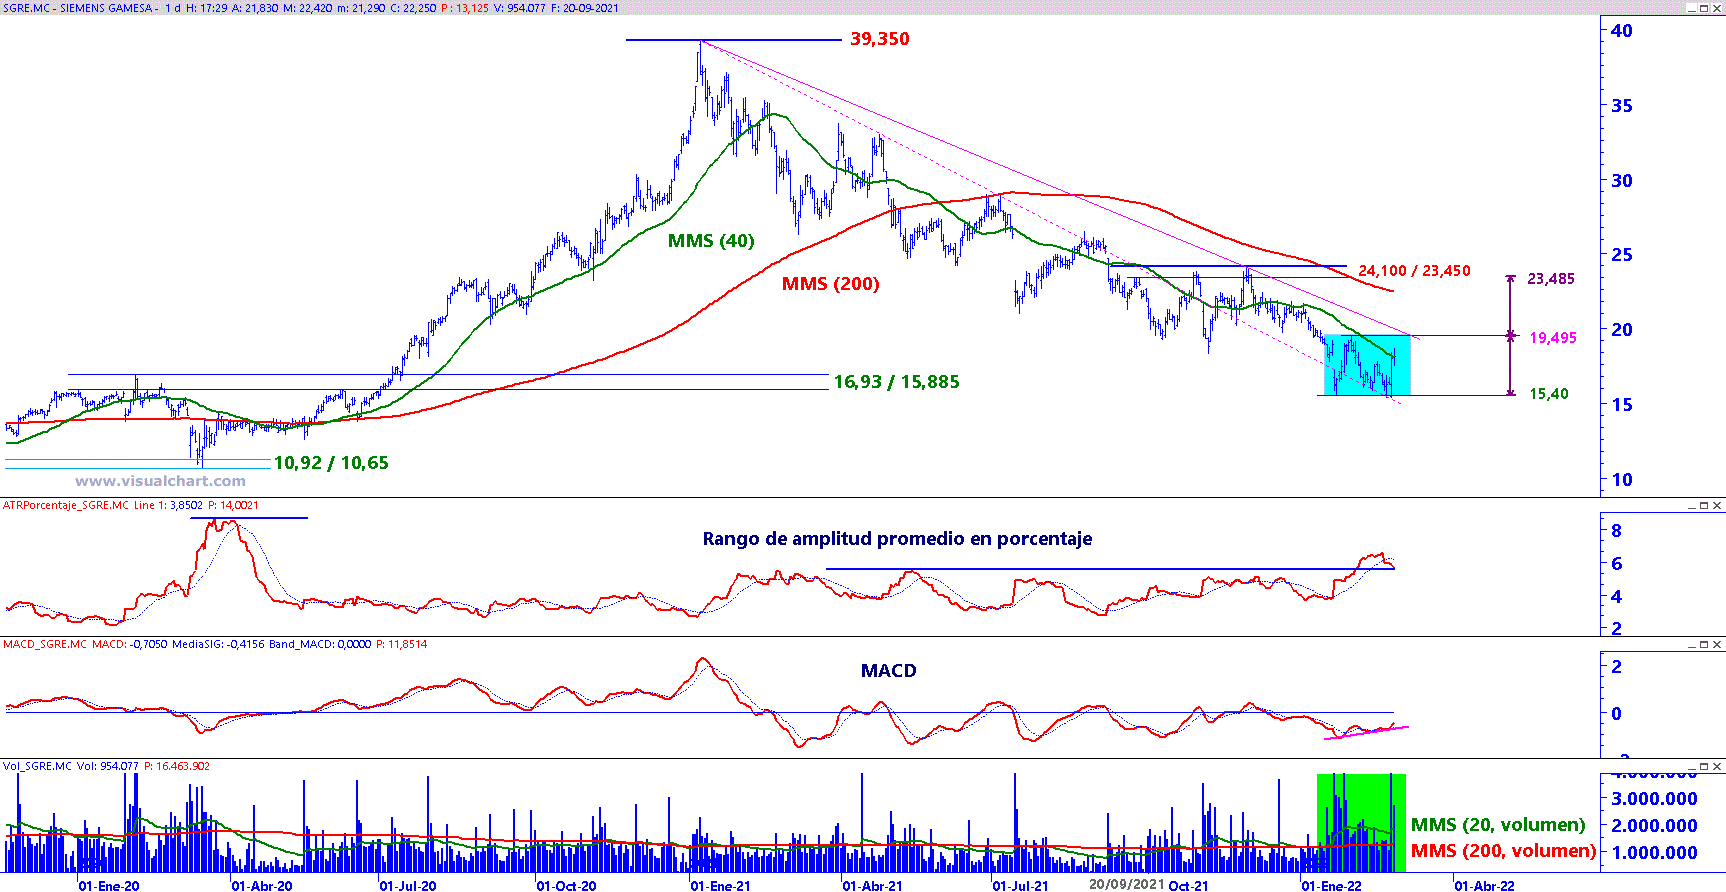
The price of Siemens Gamesa ended up forming a large bullish engulfing pattern at the daily close on FEB 24, 2022, as a result of the volatility produced in the markets by the attacks on Ukraine. This pattern has come to involve neither more nor less than the last 14 sessions, which is a very important pattern to take into account.
In the following session on FEB 25, 2022, the maximum of the bullish envelope was violated at 18.39 euros per share, activating the pattern, therefore, leaving us with fundamental support at the lows of FEB 24, at 15.40 euros per share.
The value has produced a third minimum in the support zone of 15.40 euros per share, therefore, if it exceeds the maximum between these three minimums, that is, 19.495 euros per share, it would validate a potential figure for a change in trend type triple bottom, being able to estimate a minimum upward target towards levels of 23,485 euros per share.
The price has reacted very positively in the area of previous highs 16.93 / 15.885 euros per share, simultaneously, it has been supported by the first bearish guideline dotted in fuchsia, forming a potential throwback.
Resistance levels are located at 19.495 euros and the simple moving average of 200 periods or long term. To confirm a change in trend, it is necessary to violate the last previous falling maximum, located in the area of 23,450 / 24,100 euros per share.
As a sign of strength, we see a high trading volume in the session of FEB 24 and 25, 2022. Then, the MACD oscillator expresses bullish divergence, warning of a potential change in trend.
Siemens Gamesa on daily chart with average amplitude range (upper central window), MACD (lower central window) and trading volume (lower window)

