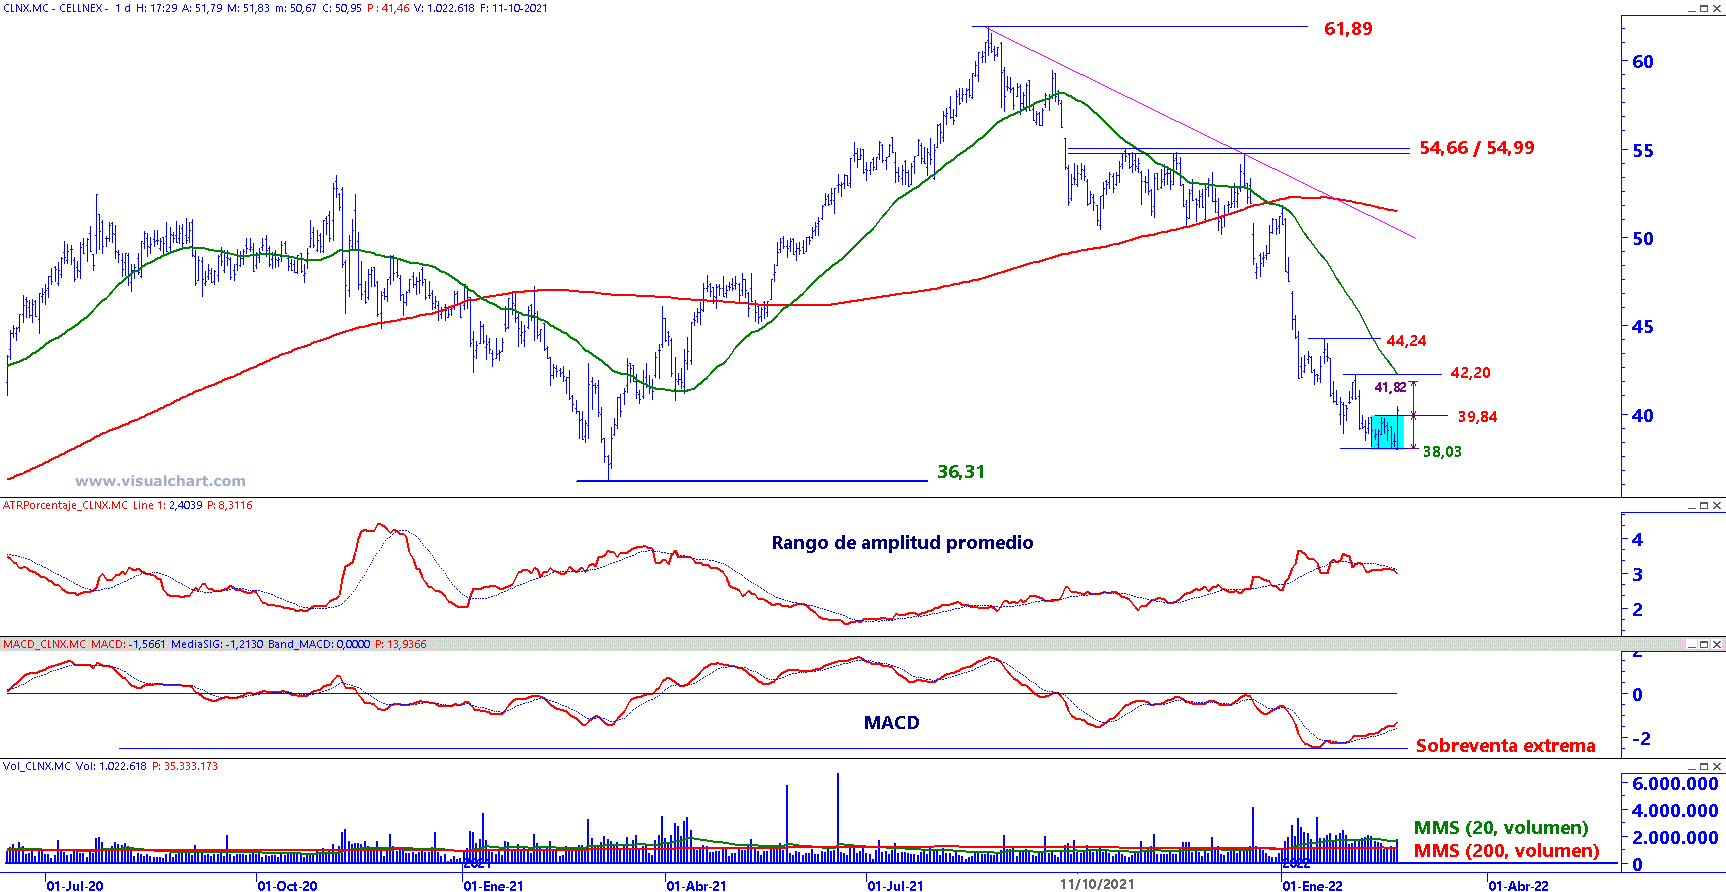
The price of Cellnex It has reacted very positively near the key support, 36.31 euros, where it has formed and validated a double bottom pattern after breaking resistance at 39.84 euros on a daily close. We can estimate a minimum bullish target for a double bottom towards levels of 41.82 euros. The invalidation point of the figure is located at 38.03 euros.
The stock began a medium-term downward trend from its all-time high of 61.89 euros per share, generating a succession of lower highs and lows. To see a change in trend, it is necessary to violate the last previous falling maximum currently located at 42.20 euros per share.
The next resistance is located at the simple moving average of 40 periods and 44.24 euros. Later on, it has resistance on the fuchsia bearish guideline, the 200-period moving average and the resistance zone around 54.66 / 54.99 euros per share.
The support level represents the low of yesterday, FEB 22, 2022, at 38.03 euros. The key long-term support is at 36.31 euros per share, since it is the minimum of the correction after a 7-month consolidation before continuing with the upward trend.
The MACD oscillator is in a good position to start a change in trend, as we see a recovery starting after generating extreme overselling.
Cellnex on daily chart with average amplitude range (upper central window), MACD (lower central window) and trading volume (lower window)

